
- October 23, 2026
- Posted by: medconverge
- Category: RCM
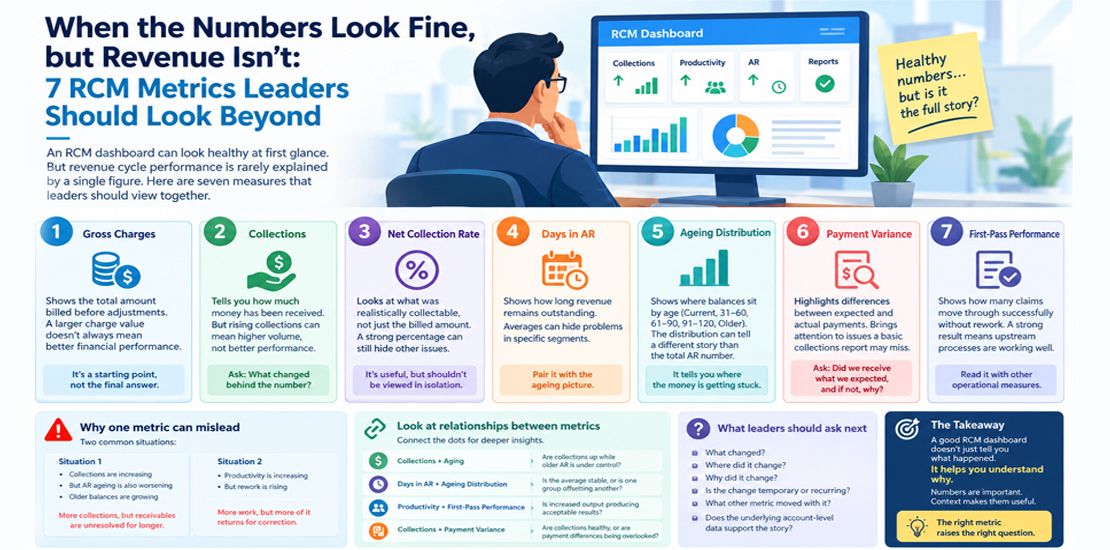
When the Numbers Look Fine, but Revenue Isn’t: 7 RCM Metrics Leaders Should Look Beyond
An RCM dashboard can look healthy at first glance.
Collections are up.
Productivity is on target.
AR is moving.
The reports are green.
Yet something still doesn’t feel right.
This is where metrics become useful — not because there are more numbers to look at, but because the right numbers can reveal what one metric hides.
Revenue cycle performance is rarely explained by a single figure.
Here are seven measures that leaders should view together.
1. Gross Charges
Gross charges show the total amount billed before adjustments and other considerations.
The number can be useful for understanding the scale of activity.
But a larger charge value does not automatically mean better financial performance.
Two organisations can report similar gross charges and produce very different results.
Why?
Because what matters is what happens after the charge enters the revenue cycle.
Gross charges are a starting point, not the final answer.
2. Collections
Collections tell you how much money has actually been received.
That makes them an important financial measure.
But even collections need context.
If collections rise because the organisation processed a higher volume of services, the increase tells a different story than an improvement in collection performance against a similar workload.
Always ask:
What changed behind the number?
3. Net Collection Rate
Net collection rate provides another perspective by considering the amount that was realistically collectable rather than simply looking at the original billed amount.
This makes it useful when assessing how effectively collectable revenue is being converted into actual collections.
But even this figure shouldn’t be examined in isolation.
A strong percentage can coexist with other problems elsewhere in the cycle.
4. Days in AR
Days in AR gives leaders an indication of how long revenue remains outstanding.
A lower number can indicate faster movement of receivables.
But averages can hide the details.
A team may have an acceptable overall figure while a particular segment of older accounts continues to grow.
That is why leaders should pair the headline number with the underlying ageing picture.
5. Ageing Distribution
Ageing shows where outstanding balances sit by age.
For example:
- Current accounts
- 31–60 days
- 61–90 days
- 91–120 days
- Older balances
The distribution can tell a different story from the overall AR number.
Imagine total AR remains stable while the oldest bucket keeps increasing.
The headline figure may look manageable.
The underlying position may deserve attention.Ageingg tells you where the money is getting stuck.
6. Payment Variance
Expected reimbursement and actual payment do not always match.
Payment variance helps identify differences that may require investigation.
This can bring attention to issues that a basic collections report won’t necessarily highlight.
The important question isn’t simply:
“Did we receive money?”
It is:
“Did we receive what we expected, and if not, why?”
That question can lead to opportunities for investigation, follow-up and revenue recovery.
7. First-Pass Performance
First-pass performance looks at what happens before repeated handling becomes necessary.
When claims move through the process successfully without avoidable correction or rework, the organisation spends less effort sending the same work backwards and forwards.
A strong first-pass result can indicate that upstream processes are working well.
A weaker result can point toward issues in documentation, coding, billing, eligibility or other parts of the workflow.
This is why it should be read alongside other operational measures.
Why One Metric Can Mislead
Consider two situations.
Situation one
Collections are increasing.
That sounds positive.
But suppose AR ageing is also worsening and older balances are growing.
The organisation may be collecting more while allowing certain receivables to remain unresolved for longer.
Situation two
Productivity is increasing.
Again, that sounds positive.
But suppose rework is rising at the same time.
More work is being completed, but more of it is returning for correction.
The output number alone doesn’t tell the complete story.
Look at Relationships Between Metrics
The real value comes from connecting the dots.
For example:
Collections + Aging
Are collections increasing while older AR remains under control?
Days in AR + Ageing Distribution
Is the average stable because of strong performance across the board, or because one group of accounts is offsetting another?
Productivity + First-Pass Performance
Is increased output also producing acceptable first-pass results?
Collections + Payment Variance
Are collections healthy because payments are accurate, or are payment differences being overlooked?
This type of analysis moves the conversation from reporting to understanding.
What Leaders Should Ask Next
When a dashboard shows a change, don’t stop at the number.
Ask:
- What changed?
- Where did it change?
- Why did it change?
- Is the change temporary or recurring?
- What other metric moved with it?
- Does the underlying account-level data support the story?
Those questions turn a dashboard into a management tool.
A Dashboard Should Explain, Not Decorate
An RCM dashboard is not useful simply because it contains many charts.
Its value comes from helping leaders see what deserves attention.
A strong reporting approach connects financial outcomes with operational activity.
It helps distinguish between:
- More work and better work
- More collections and better collection performance
- Lower AR and healthier ageing
- Higher productivity and sustainable output
- Fewer visible issues and genuinely fewer issues
Numbers are important.
Context makes them useful.
The Takeaway
A good RCM dashboard doesn’t just tell you what happened.
It helps you understand why.
That is where leaders can move from monitoring performance to improving it.
The most useful metric is rarely the number that looks best on the screen.
It is the number that raises the right question.